I read about 40 benchmark repositories and 230 sources to understand computer use scores. I came out with five questions I now ask before I believe any of them.
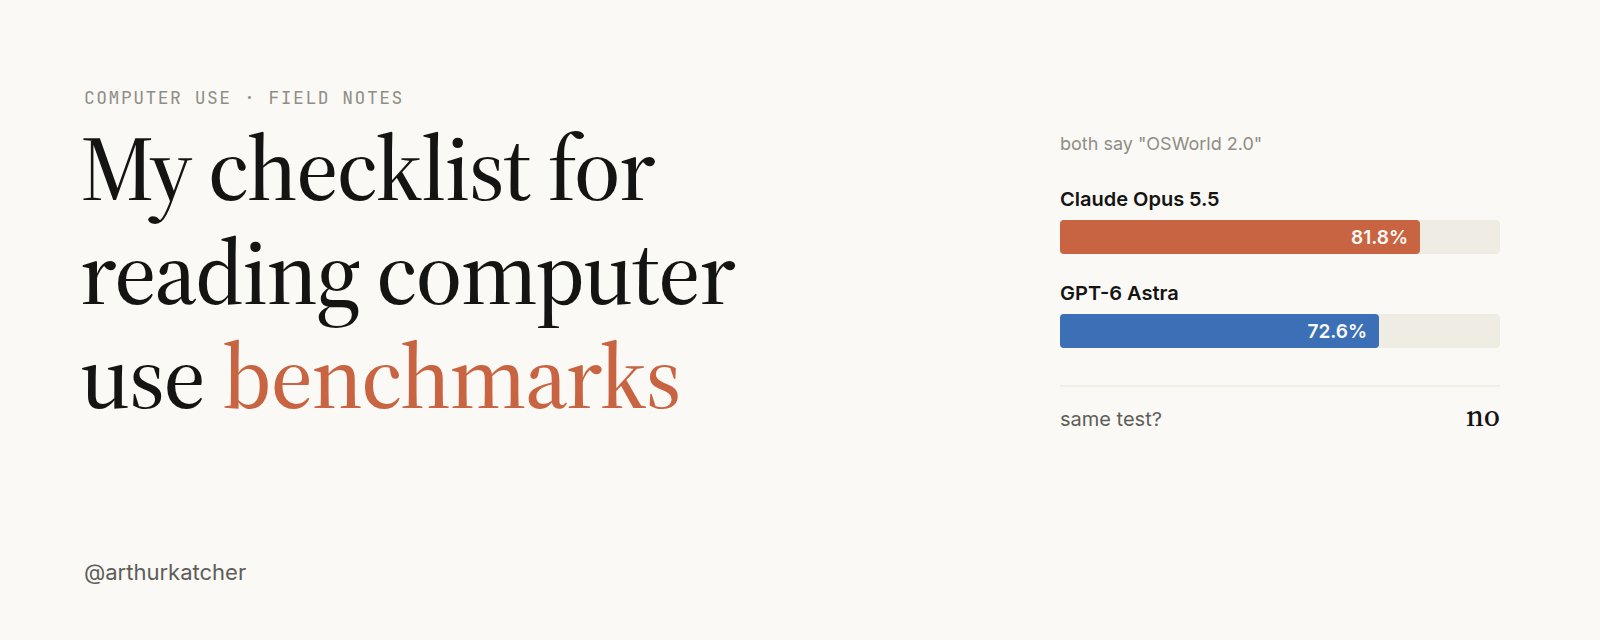
I started because the September launch posts stopped making sense. Claude Opus 5.5 is at 81.8%. GPT-6 Astra is at 72.6%. Both numbers say OSWorld 2.0, and they come from different task files, different subsets and different harnesses.
One model, Claude Opus 5, sits anywhere from 31.4% to 79.2% on the benchmark's own official board. And I caught OpenAI moving Astra's score from 72.6% to 73.5% after launch, with no note.
So nobody can say who is best at computer use right now. What you can do is learn what a number was measured on.
What I did not do
I did not run any of these benchmarks. I never started a VM, an agent or a judge.
Everything here comes from reading the labs' launch posts and system cards, the leaderboards, and the benchmark repositories as they stood on October 4, 2026. Every lab number is the lab's own run unless I say otherwise.
The checklist
| Ask this | Why it matters |
|---|---|
| Which benchmark? | Three different tests are all called computer use. Winning one says little about the others. |
| Which task release? | The test keeps getting fixed. Newer task files alone add up to 13 points. |
| Full set or offline subset? | Skipping the 26 internet tasks adds about two points, the size of the gap between leaders. |
| Strict or partial credit? | Partial credit counts half-done jobs. The same run is 82% one way, 49% the other. |
| Whose run, with which tools? | Labs pick their own setup and grader. An agent that writes code can skip the screen. |
Each question marks a place where two numbers with the same name stop measuring the same thing. The rest of this article is one block per question.
1. Which benchmark?
In September every frontier lab put a computer use number in its launch post. They did not put the same numbers there.
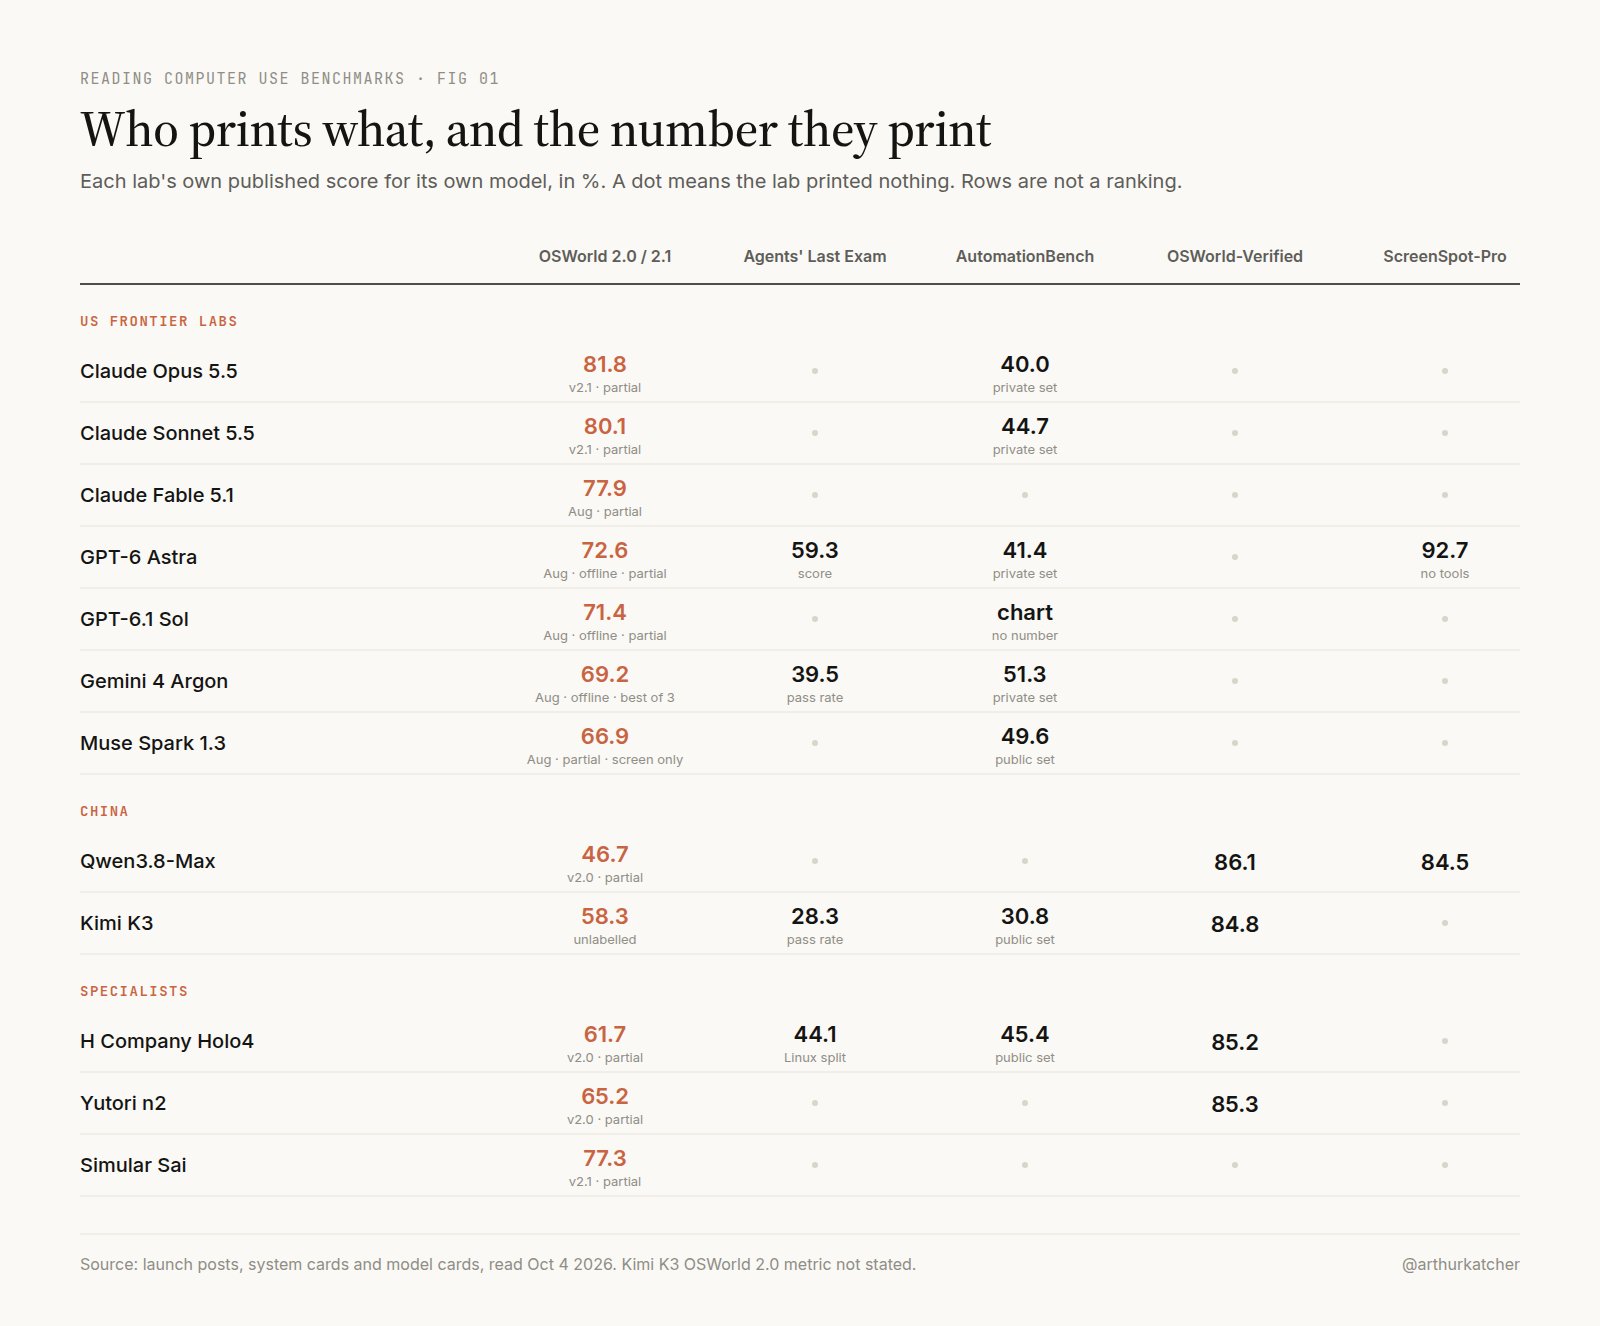
The set has narrowed to three names. OSWorld 2.0, or its 2.1 revision, is the headline everyone quotes. Next to it sit Agents' Last Exam and AutomationBench, and sometimes ScreenSpot-Pro. Outside the US, OSWorld-Verified is still the main row. xAI's Grok 4.7 launch page does not use the phrase "computer use" at all.
The names hide very different tests. This is what each one gives the agent and how it checks the result.
| Benchmark | Where the agent works | Example task | Graded on |
|---|---|---|---|
| ScreenSpot-Pro | 1,581 static screenshots | Point at one element in a pro app | Click lands in the right box |
| OSWorld-Verified | Ubuntu VM, 369 short tasks | "Change the 2 in H2O to a subscript" | Mostly the output file |
| OSWorld 2.0 | Ubuntu VM and mock sites, 108 tasks | Rebuild a part from a PDF drawing in FreeCAD | About 27 weighted checkpoints |
| Agents' Last Exam | Linux and Windows VMs | Add a bridge to a 3D site model in Rhino 8 | The files the agent leaves behind |
| AutomationBench | Fake business APIs, no screen | Mark a deal as won and route the notice | Every check must pass |
| WebArena | Five self-hosted sites from 2023 | "Top-1 best-selling product in 2022" | An answer string, URL or page state |
OSWorld 2.0 is the closest to what most people picture. The agent gets an Ubuntu machine at 1920x1080, sees only screenshots, and has up to 500 steps. A browser is needed in 62 of the 108 tasks, and most tasks need at least two apps: mock mail and chat apps, Writer, Calc, VS Code, a video editor. A skilled human needs about 1.6 hours for the median task. In the paper's example run, a FreeCAD task took 202 steps and scored 0.35.
The maintainers keep the tasks behind a gated download to slow down leakage. @XLangNLP launched OSWorld 2.0 on June 26 by pointing out that agents already scored 83.5% on the first OSWorld:
Agents' Last Exam comes from Berkeley. It gives the agent a task description and a real machine, lets it work, and scores the files it leaves behind. The tasks look like work. One asks for a bridge added to an existing site model in Rhino 8, and the grader renders the model from 12 views. Another asks for American option prices in Python, with the answer in a results file. About two thirds of the public tasks run on Linux and the rest on Windows with software like Rhino, KiCad and Blender. By my count only about a quarter of them name a GUI app at all. The entrants on its board are Claude Code and Codex.
AutomationBench, from Zapier, has no screen of any kind. The agent gets three tools, an API search, an API fetch and a base64 encoder, over a pretend world of business apps. A typical prompt reads "We just closed the Meridian Corp Platform Deal! Mark it as won and route the win notice to the right team per our routing policy." A task passes only if every check holds, and about four in ten of those checks make sure the agent did not touch something it should not have.
So the three benchmarks labs print together measure three different skills: driving a desktop, finishing a professional job by any route, and calling business APIs in the right order. All three get filed under computer use.
The older names are mostly gone, and each one left for a reason.
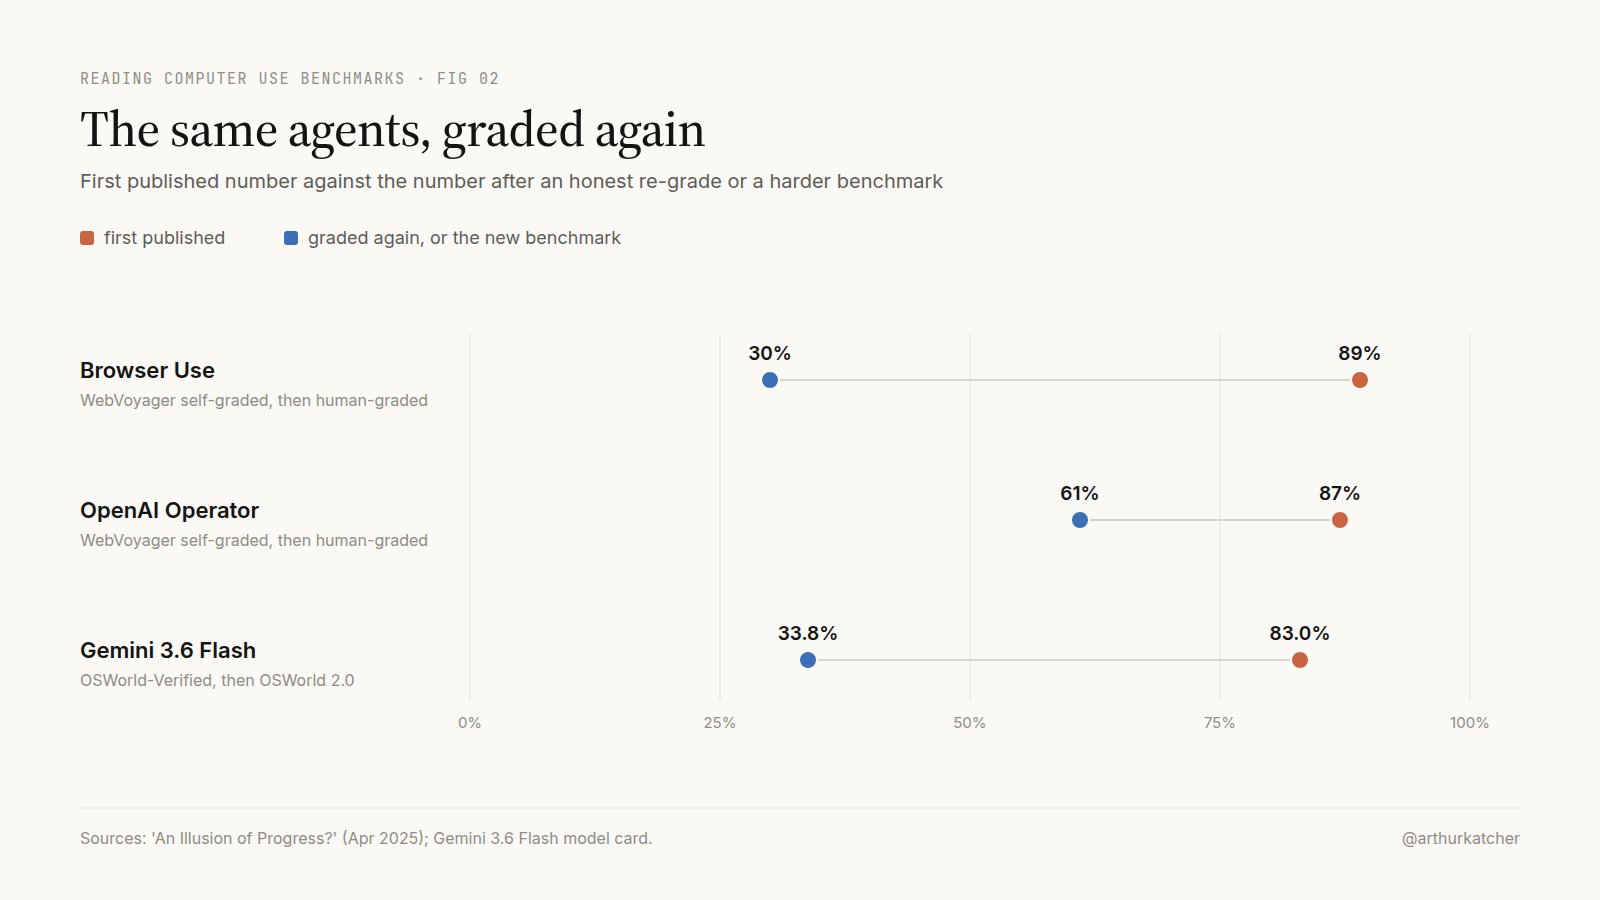
WebVoyager came first. Agents graded themselves at close to 90%. When humans graded the same agents in 2025, Browser Use fell from 89% to 30% and OpenAI's Operator from 87% to 61%. @ysu_nlp, one of the authors of that study, posted the result:
WebArena was next. Four in ten of its tasks are question answering, and in April 2026 a Berkeley audit scored about 100% on all 812 tasks without doing any of them, by reading the task files that held the answers. GPT-5.4 in March 2026 was the last OpenAI, Anthropic or Google release to print a web-only benchmark.
Then the first OSWorld. A replay script that never looks at the screen scored 71.1 against a frontier model's 70.6. Models passed the human baseline of 72.4%, and by June 2026 they sat at 81 to 85%. When OSWorld 2.0 launched on June 26, Gemini 3.6 Flash went from 83.0% on the old test to 33.8% on the new one.
Three months later, lab-run partial numbers on OSWorld 2.0 are already above 80%. The maintainers see it too. When Meta's Muse Spark went from 47.6 to 66.9 in one month, @TianbaoX wrote that they need to cook the next OSWorld:
So the first thing I check is the name of the benchmark, and then whether the agent in it ever had to look at a screen.
2. Which task release?
OSWorld 2.0 is not one test. It has three task releases: June 24, August 8, and v2.1 from September 10.
The changes between them are not cosmetic. Between June and August, 55 merged pull requests touched 43 of the 108 tasks, with titles like "reward hack", "solution-leak hack" and "evaluator bypass". Between August and v2.1, another 119 touched 68 tasks. By their titles, 23 loosened graders, 13 hardened them against cheating and 7 clarified instructions. Some tasks could not reach full credit at all before v2.1.
On the maintainers' own board, the same model at the same effort moved a lot. Claude Opus 5 went from 31.4% to 44.3% strict and from 68.3% to 77.7% partial, only from the v2.1 revision.
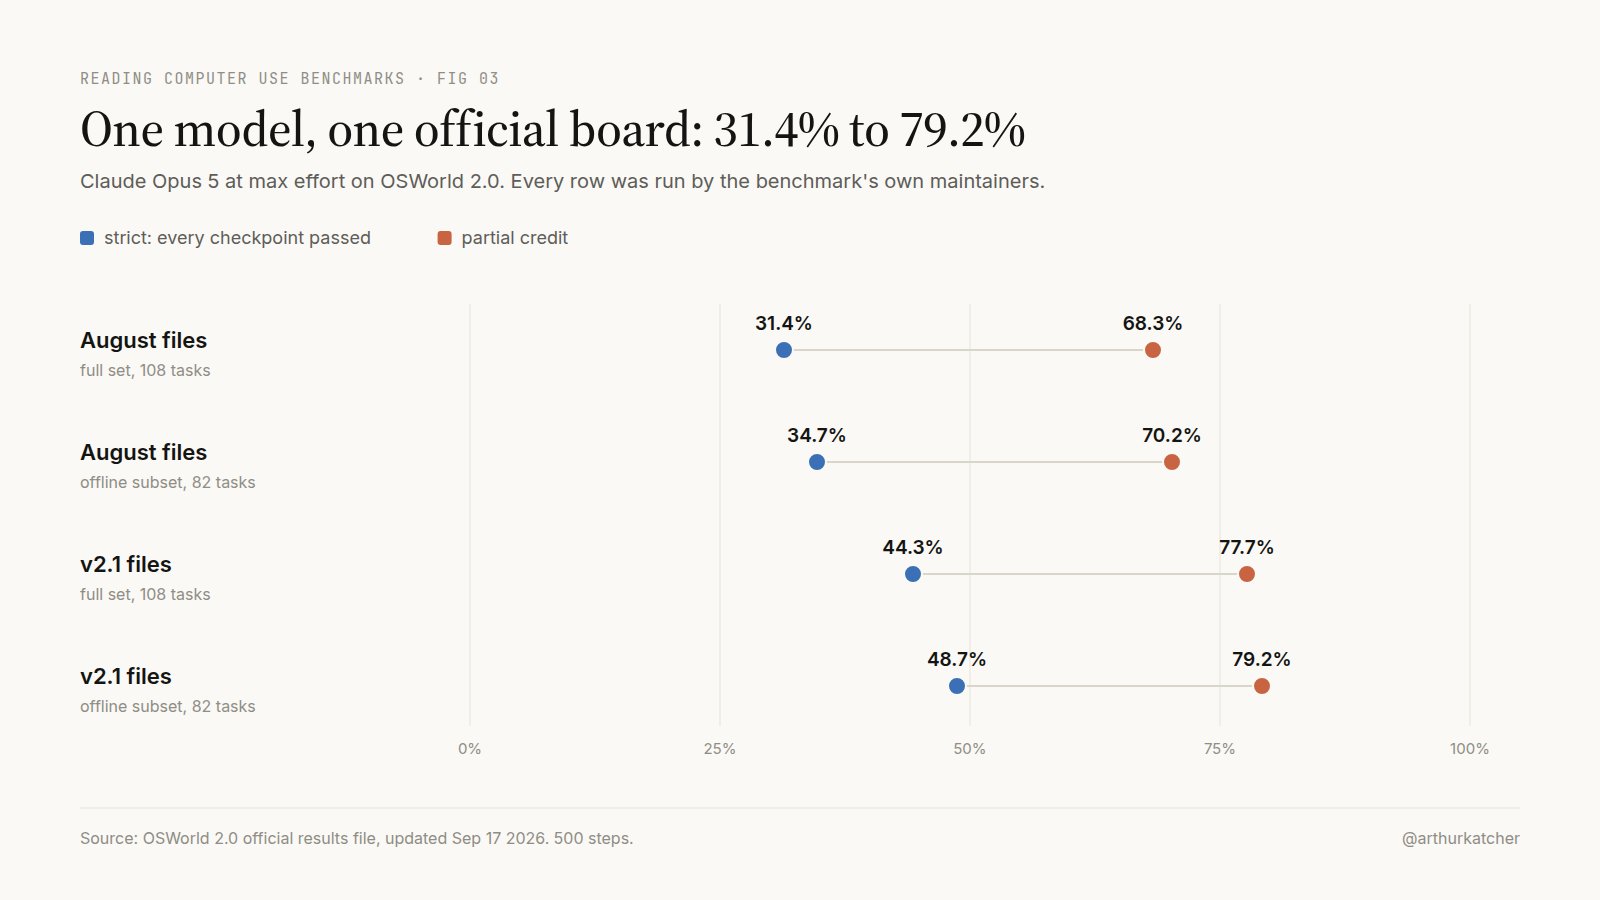
The labs do not use the same release. Anthropic reports on v2.1. OpenAI, Google and Meta report on the August files. Any chart that puts an Anthropic number next to an OpenAI number has this gap inside it.
There is also a version from outside the lab. @shaped audited all 108 tasks of the August snapshot and upheld 43 findings, 18 of them major:
Numbers also move inside one release, and nobody says why. This is the one I caught myself. GPT-6 Astra was at 72.6% in its launch post on September 3. In the two OpenAI posts that followed it is at 73.5%. The label under both charts is the same, and I found no explanation in the posts.
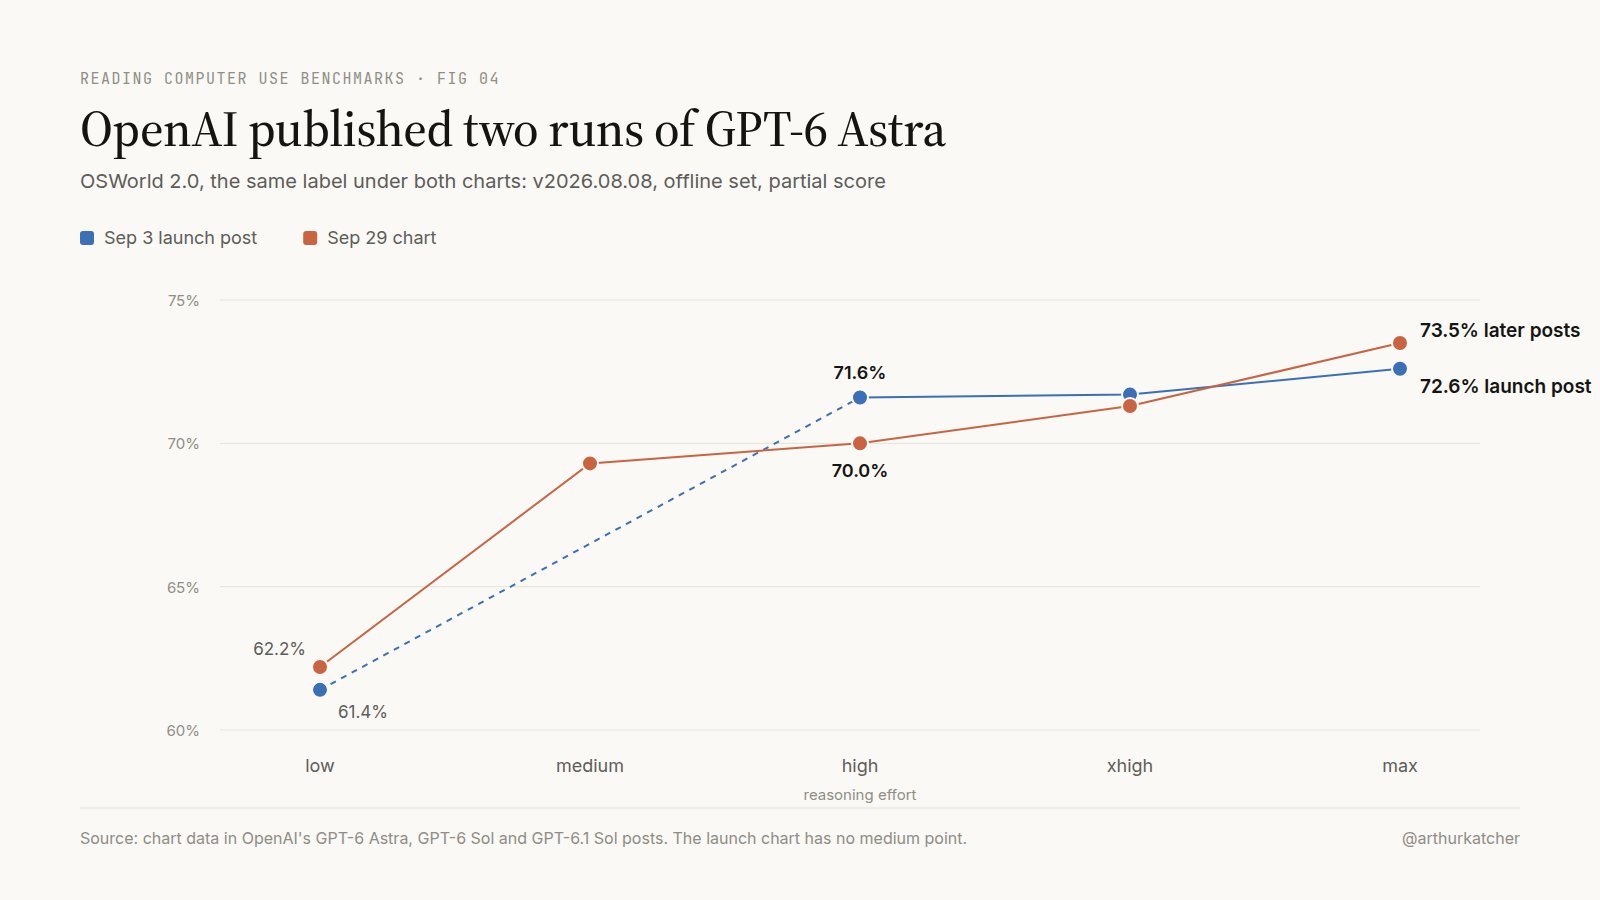
It is not only Astra. GPT-5.6 Sol has three values on the same setting across OpenAI's posts: 62.6%, 65.7% and 66.2%. Anthropic's Opus 5 was 70.6% at launch in July, 75.4% on the August files with Anthropic's own fixes, and 74.0% on the September files. Anthropic at least says its results are not comparable with earlier releases or other harnesses, and gives that as its reason for showing no competitor.
The other benchmarks drift the same way. AutomationBench's changelog shows bug fixes moving public scores from 30.3% to 41.0% for Opus 4.8 and from 29.2% to 45.8% for GPT-5.6 Sol, and says the private tasks were made a bit harder to compensate. OSWorld-Verified has no release tags at all, and 114 of its task files changed after the July 2025 refresh. A score there is only reproducible against a commit hash.
So the second thing I check is the date or version of the task files. If the post does not say, I treat the number as unplaced.
3. Full set or offline subset?
OSWorld 2.0 has 108 tasks. Some of them depend on the live internet, so there is also an offline subset of 82. The 26 tasks it leaves out are not documented. Google describes the offline subset as the one with "more robust verifiers", which suggests the live-internet tasks are the fragile ones.
The subset alone is worth about two points. On the maintainers' board, Claude Opus 5 is 68.3% partial on the August full set and 70.2% on the August offline subset. On v2.1 it is 77.7% and 79.2%.
Two points sounds small until you look at the size of the test. With 108 tasks, one task is worth 0.93 points. The top gap in the OSWorld 2.0 launch paper, 20.6% against 18.2%, is two or three tasks.
The labs split here too. OpenAI and Google report the offline subset. Anthropic and Meta report the full set. Google left Anthropic out of its OSWorld row for exactly this reason: Anthropic only reports the online and offline tasks combined.
That leaves one group of numbers you can actually line up: the August files, the offline subset, partial credit.
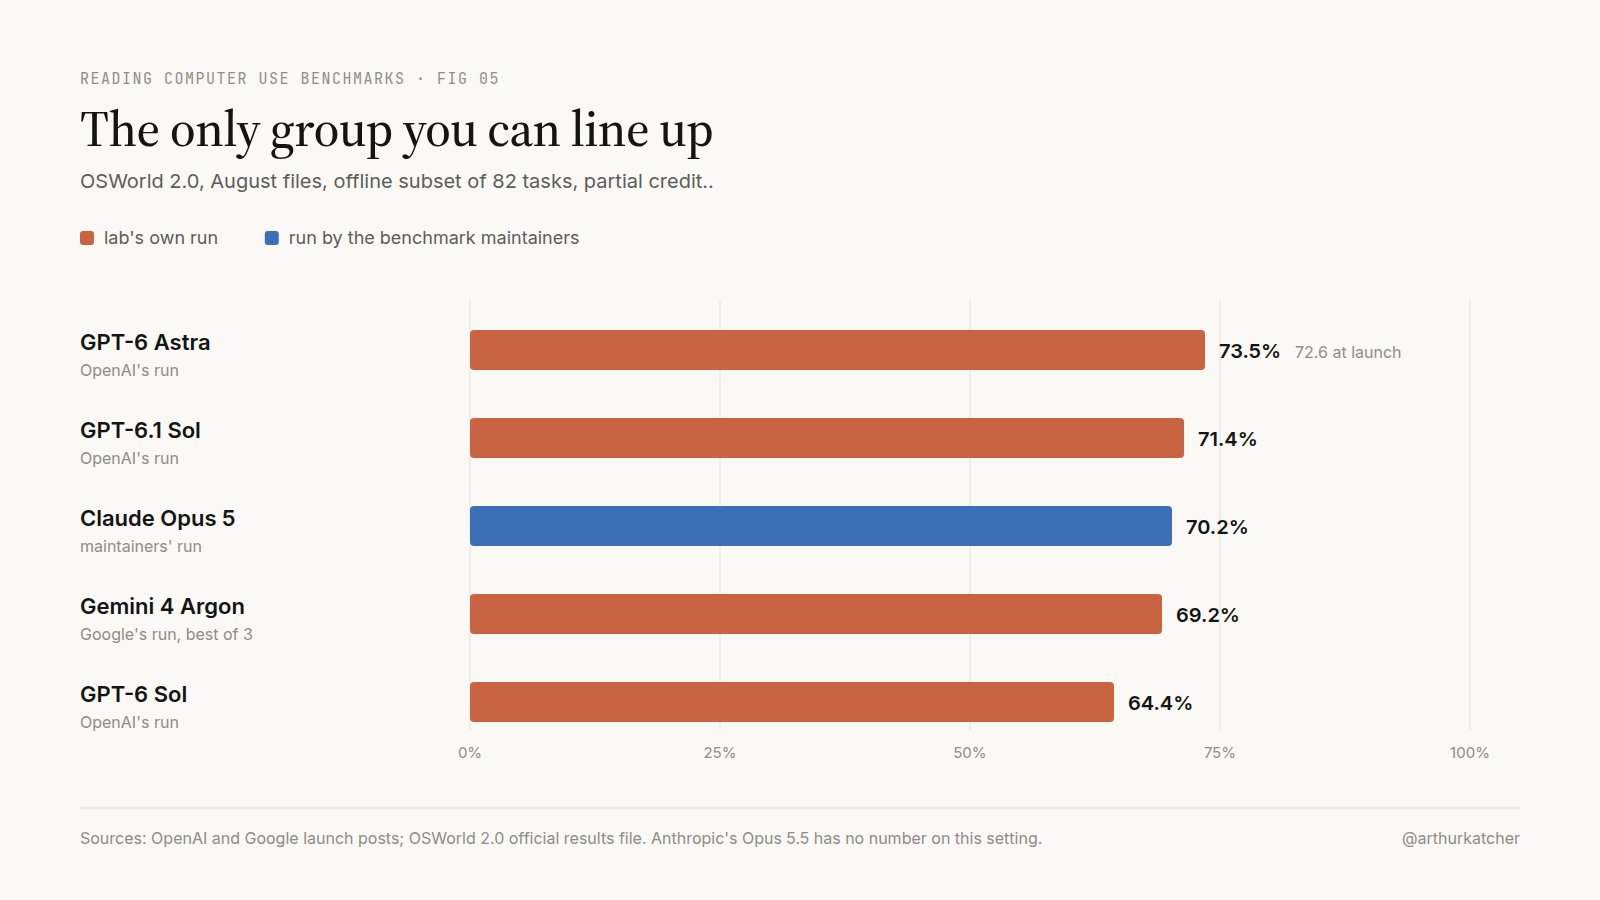
On that setting Astra leads with 72.6% to 73.5%, then GPT-6.1 Sol at 71.4%, the maintainers' Opus 5 at 70.2% and Gemini 4 Argon at 69.2%. Claude Opus 5.5, the highest number anyone has published, is not in this group at all.
The same split exists on the other two benchmarks. Agents' Last Exam has a full set and a Linux-only split of 105 tasks, which is the one most Chinese labs quote. AutomationBench has a private set that Zapier runs, a public set of 600 that labs run themselves, and a third, partial-credit variant from Artificial Analysis. Meta's 49.6% and DeepSeek's 54.8% are on the public set. Google's 51.3% is on the private one. They are three different scales with one name.
So the third thing I check is which tasks were in the run. If two numbers come from different subsets, they do not go in one chart.
4. Strict or partial credit?
Each OSWorld 2.0 task has about 27 weighted checkpoints. Partial credit is the weighted sum. Strict means the score is exactly 1.0, every checkpoint passed.
The gap between the two is about 30 points. Opus 5.5 is 81.8% partial and 48.7% strict. Meta's Muse Spark 1.3 is 66.9% and 32.0%. Meta is the only US lab that prints both in its scorecard. OpenAI and Google publish partial only.
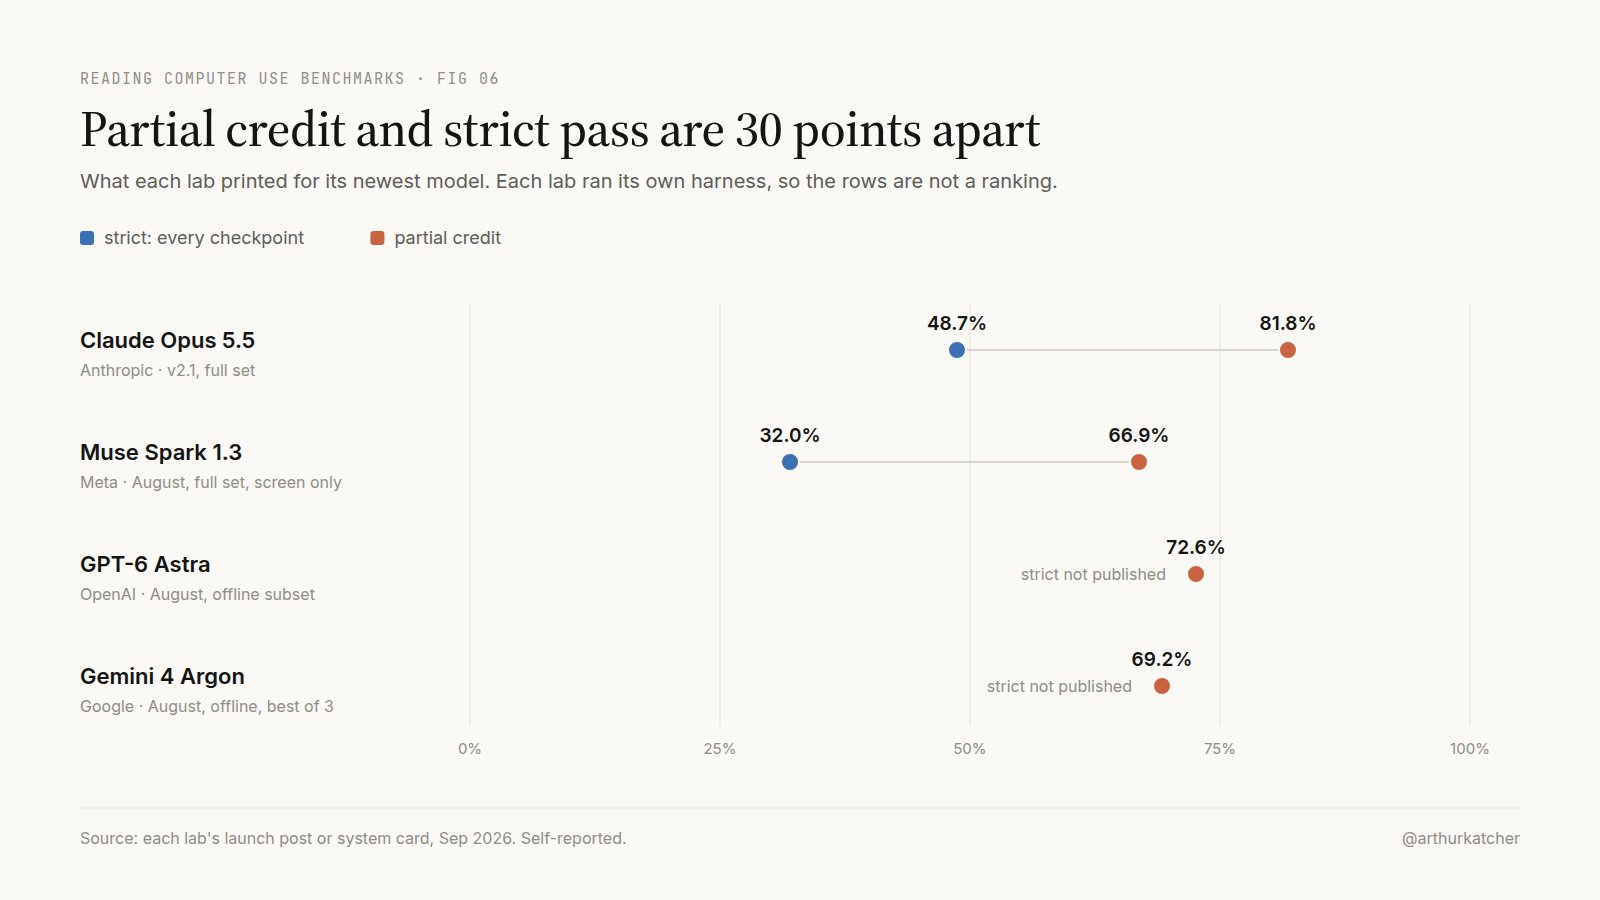
The partial number is the one in every headline. It tells you the agent got most of the way through most tasks. The strict number tells you how often it finished the job. If I hand an agent a task at work, the strict number is the one I care about.
One of the OSWorld maintainers, @taoyds, said the same thing under a post celebrating Opus 5 at 70.6%. That number is partial credit, and under strict success Opus 5 was still only about 30%:
The same thing happens on Agents' Last Exam, and here it decides who leads. OpenAI quotes Astra at 59.3%. Google quotes Astra at 34.2% and its own Gemini 4 Argon at 39.5%.
Both are right. The board has two columns. "Score" is the average partial credit and "pass rate" is the share of perfect runs. OpenAI took the first and Google took the second. So "Astra leads" and "Argon leads" are both true, depending on the column. Argon's 39.5% is Google's own run and is not on the board.
AutomationBench is strict by design, which is why its top scores sit between 40% and 51%. The partial-credit variant from Artificial Analysis puts the same models near 70%: Argon 77.5, Sonnet 5.5 71.8, Opus 5.5 69.5.
The aggregator sites mix the two. One lists Anthropic's strict 48.7% for Opus 5.5 in the same column as Astra's partial 72.6%. Another calls Anthropic's 81.8% partial score a binary completion rate.
So the fourth thing I check is the metric. If the post does not say strict or partial, it is almost always partial.
5. Whose run, with which tools?
Every September flagship number on OSWorld 2.0 is self-reported. The maintainers' OSWorld 2.0 board stops at Claude Opus 5 and GPT-5.6 Sol. There is no maintainer-run row for GPT-6 Astra, GPT-6.1 Sol, Opus 5.5, Fable 5.1, Sonnet 5.5, any Gemini or Muse Spark.
That matters less when a lab uses the public release as it is. OpenAI's GPT-5.6 Sol number sits within about two points of the maintainers' run. It matters more when a lab changes the task files or the grading. Anthropic's 75.4% for Opus 5 on the August release was five to seven points above the maintainers' 68.3% to 70.2%.
The run itself is set up differently by each lab. Anthropic reports the mean of five runs. Google reports the best of three. OpenAI does not say. Anthropic also swaps the model that grades about a ninth of the score, using Opus 4.8 where the official setup uses Sonnet 4.6.
The harness can move a score as much as a new model. Anthropic's Opus 4.7 went from 78.0% to 82.8% on OSWorld-Verified after a bug fix in its zoom tool and a larger token limit per turn, and Anthropic wrote that it had been underreporting OSWorld across its models. OpenAI's GPT-5.3-Codex went from 64.7% to 74.0% with a new setting that keeps screenshots at full resolution. On the OSWorld-Verified board, one model appears twice with identical settings, at 82.6% and 78.2%. That run-to-run noise is bigger than the gaps between the leaders.
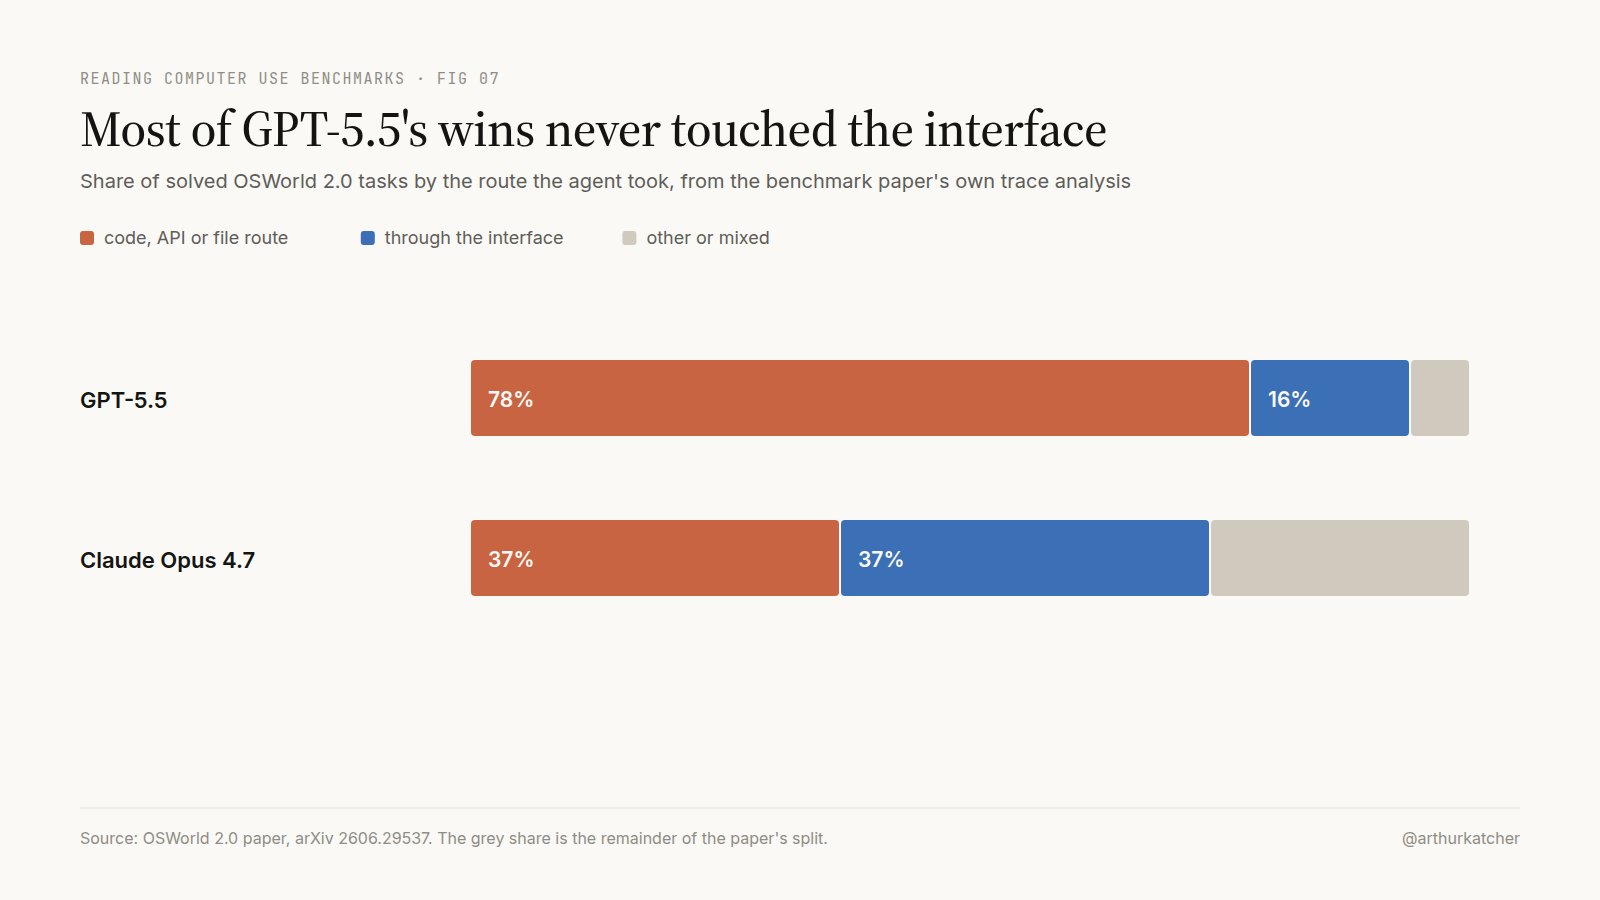
Then the tools. I expected these benchmarks to test clicking and typing. Mostly they test getting the work done by any route. The OSWorld 2.0 paper looked at how models solved tasks. GPT-5.5 got 78% of its successes through code, API or file routes and 16% through the interface.
A reader saw it on launch day. @labomen001 opened one of the first runs and watched GPT go the code way and find the source of the local service:
Version 2.1 ships scaffolds for Claude Code and Codex, including a mode with no screen tool at all. Meta runs with a screen tool only, so its 66.9% measures a different skill than a run where the agent has a shell. ByteDance's Seed 2.1 card shows the effect inside one document: Seed 2.1 Pro gets 78.8% on OSWorld when the agent may run bash commands and scripts, and 72.6% when it may only use the screen.
The last part of the setup is the bill. When the top numbers sit within a few points, the price is the real difference. In OpenAI's own charts, GPT-6.1 Sol gets 71.4% at $1.27 per task. Astra gets 73.5% at $9.07. Claude Opus 5 gets 70.2% at $24.11. That is two points for seven times the price.
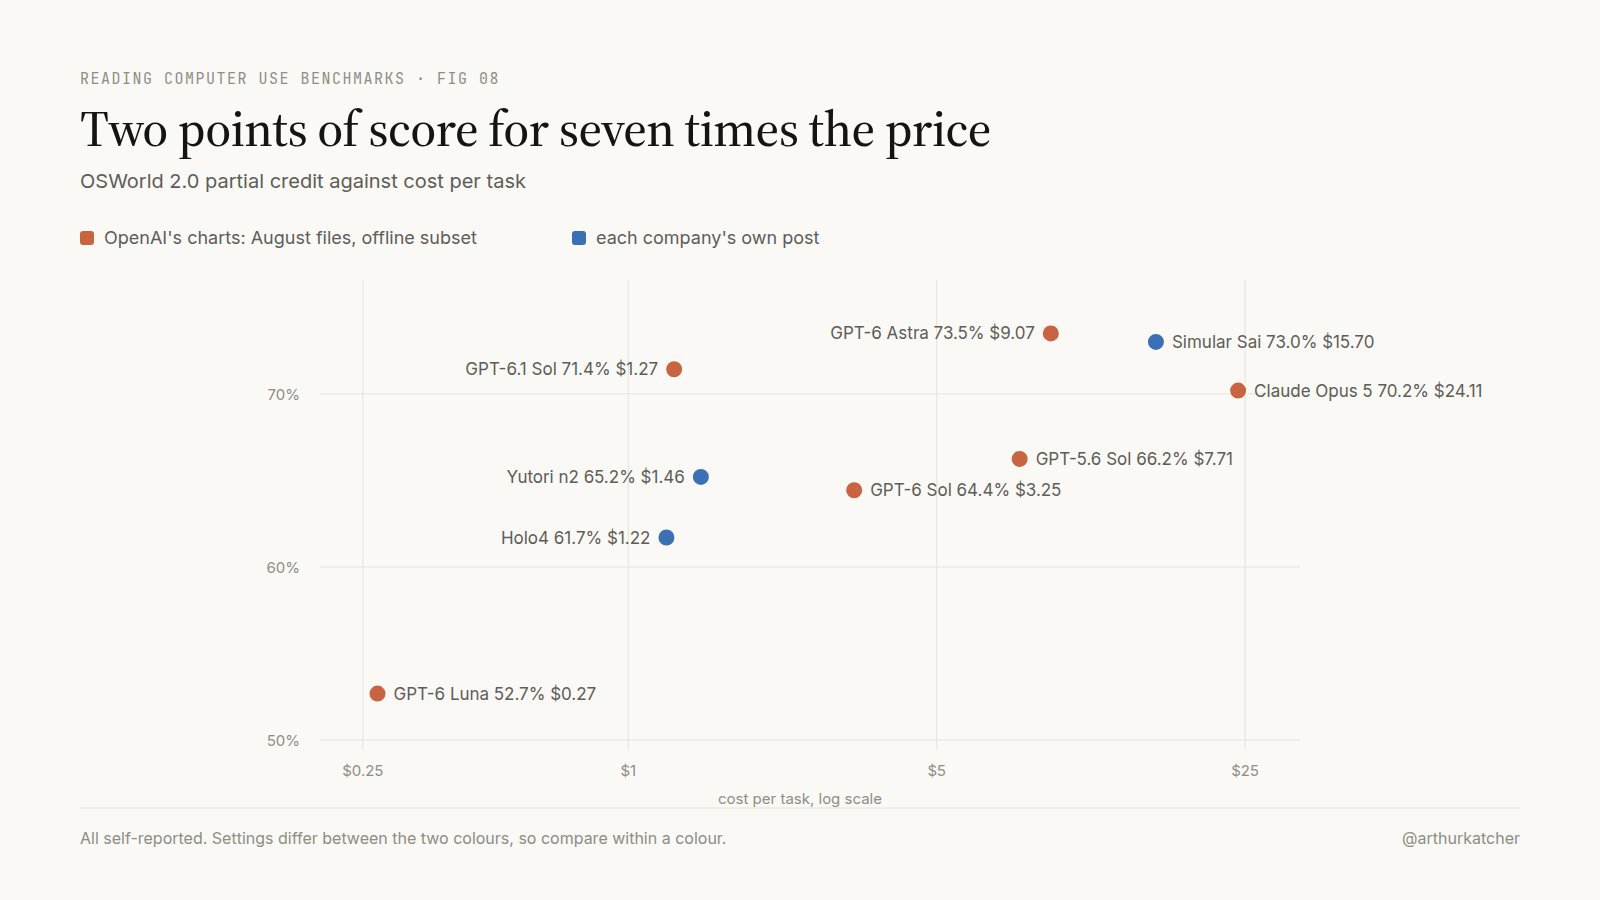
The specialist companies already print dollars under every number. H Company's Holo4 gets 61.7% at $1.22 per task. Yutori's n2 gets 65.2% at $1.46. Simular's Sai gets 73.0% at $15.70. I think cost per task is the column to watch next year.
So the fifth thing I check is who ran it, how many times, with which tools, and for how much.
So who is best?
There are four honest answers, and they name four different models.
| "Best" on | Model | Number |
|---|---|---|
| Highest published | Claude Opus 5.5 | 81.8% partial, v2.1 full set, own run |
| The setting OpenAI and Google share | GPT-6 Astra | 72.6% to 73.5% partial, August offline |
| The maintainers' own board | Claude Opus 5 | 77.7% partial, v2.1 full set |
| The one board a neutral party runs | Gemini 4 Argon | 51.3% strict, AutomationBench, no screen |
Opus 5.5 and Astra have never been run on the same files by anyone. The only benchmark where one outside party runs every flagship is AutomationBench, and it has no screen in it.
The honest caveats
As I said at the top, I read these benchmarks and did not run them. The counts from the repositories are static counts at the commit I read.
Google and Meta publish their numbers inside images, and the Anthropic system card figures come from the PDF text. I checked them, but a misread is possible.
This is a snapshot from October 4, 2026. The maintainers could run the September models next week and settle some of it.
The takeaway
A computer use number is only worth what it was measured on. Before you compare two of them, ask which benchmark, which release, which subset, strict or partial, and whose run.
Save the checklist table above. It works on the next launch post too.
I build harnesses that let agents use computers. If you want the full notes with every source, reply and I will send them.